Mastering Business Intelligence with Power BI
Join our upcoming workshop to learn, connect, and grow with industry experts.
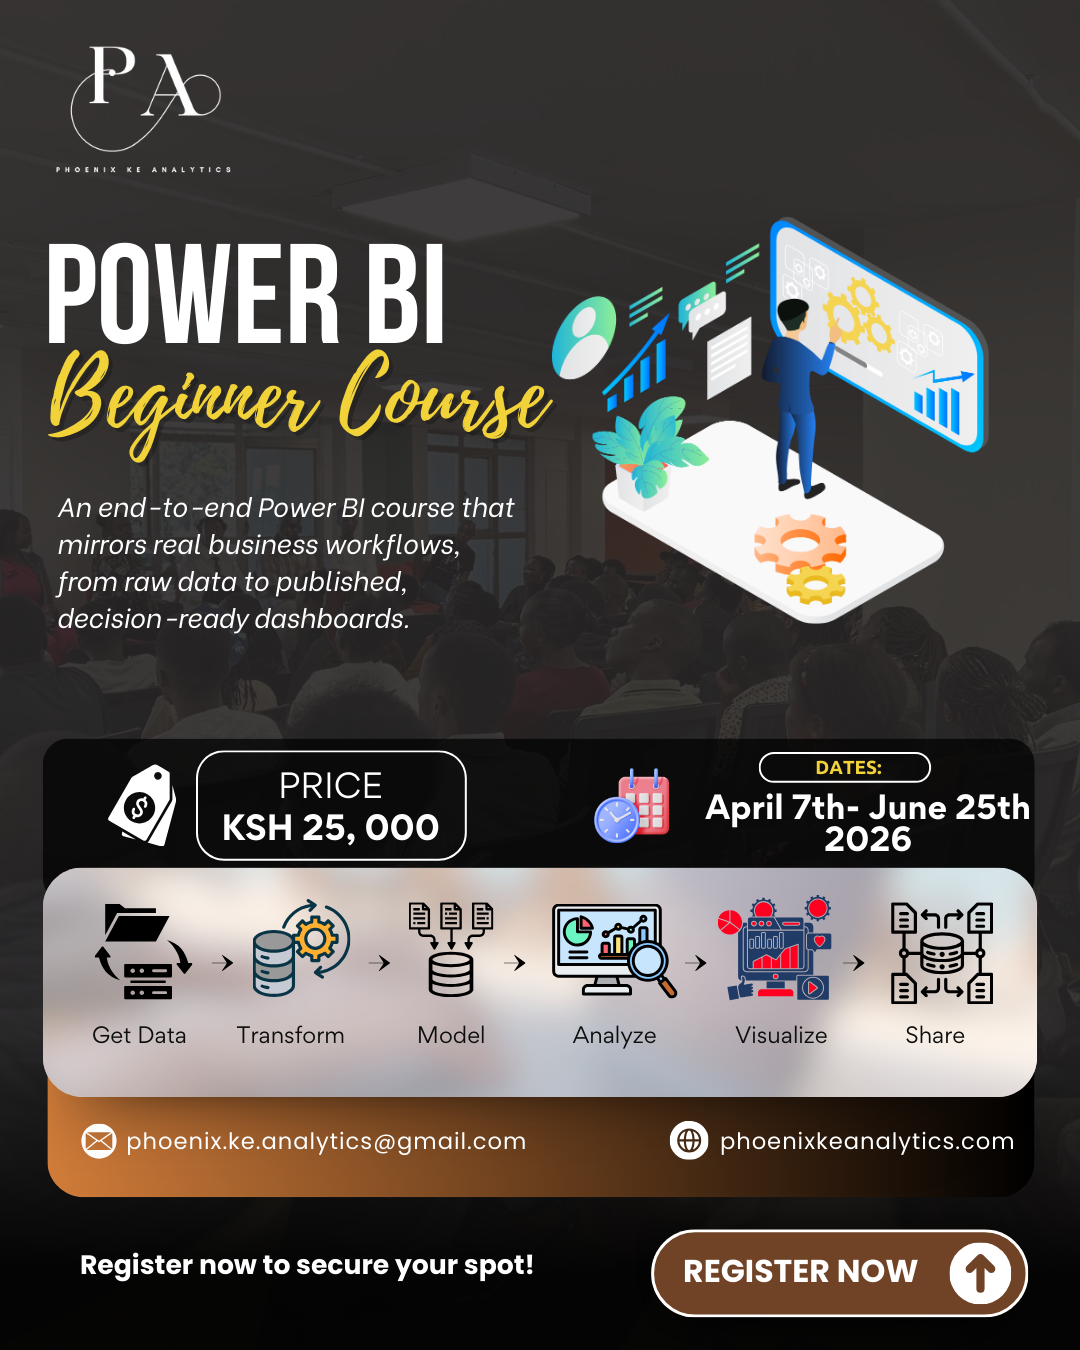
Workshop Details
From: April 7, 2026 – To: June 25, 2026
Time: 7 PM-8:30 PM
Platform: Microsoft Teams
Amount: KES 25,000
About this Workshop
MASTERING BUSINESS INTELLIGENCE WITH POWER BI
Consolidated Training Framework
Training Objective
To equip learners with practical, end-to-end Power BI skills covering:
• Data Connectivity
• Transformation (ETL)
• Star schema modeling
• DAX calculations
• Interactive dashboard design and enterprise deployment via Power BI Service
By the end, participants will independently build and publish production-ready dashboards from raw datasets.
Delivery Days: Tuesday & Thursday (Live Sessions)
Why It Matters
1.From chaos to clarity: This course teaches the ETL (Extract, Transform, Load) process, allowing you to turn messy folders of CSVs and Excel sheets into a clean, automated "Single Source of Truth."
2.The end of manual reporting: By mastering Power Query (The "Kitchen"), you stop manually cleaning data every month. You build the logic once, and the reports update automatically forever
3.Modeling is the Backbone: Pretty charts built on bad data lead to bad decisions. We emphasize Data Modeling and Star Schemas (Fact vs. Dimension) to ensure your analysis is accurate, scalable, and performant—something most beginners overlook.
4.The "Why" Behind the "What": DAX (Data Analysis Expressions) allows you to ask deep questions; like "Year-over-Year Growth" or "Customer Retention Rates"; that drive actual business strategy.
5.Storytelling, Not Just Reporting: Data is only valuable if it is understood. We move beyond basic bar charts to teach Data Storytelling and UI/UX design, ensuring your dashboards are intuitive, accessible, and persuasive for executive stakeholders.
Prerequisites
1.Operating System: A computer running Windows 10 or 11 (Power BI Desktop is not natively supported on Mac/Linux).
2.Software: Microsoft Power BI Desktop (Free download) installed.
3,Data Literacy: A basic understanding of data concepts (e.g., what a table, row, and column are) and familiarity with Microsoft Excel (specifically Pivot Tables and basic formulas like SUM/IF) is highly recommended.
4.Account Requirements: A work or school email address is required to sign up for the Power BI Service to fully participate in Module 6 (Publishing & Security). Personal emails (Gmail/Outlook) have limitations for the service component.
Day | Date | Objectives | Delivery |
Module 1: Power BI Foundations & Data Connectivity | |||
Tuesday | 4/7/2026 | Lesson 1: The Power BI Ecosystem • Introduction to Business Intelligence & Power BI (Desktop vs. Service). • Downloading, Installing, and configuring regional settings. • The "Modern" Interface: Navigating Report, Data, and Model views. | Online (Live Session) |
Thursday | 4/9/2026 | Lesson 2: Connecting to Data Importing Excel, CSV, and Folder data • Web data extraction basics • Manual tables and database connectivity • Hands-on Lab: Connect to 3 different data sources and inspect schema differences. Hands-on Lab: Connect to 3 different data sources and inspect schema differences | Online (Live Session) |
Module 2: Advanced Data Shaping (ETL) | |||
Tuesday | 4/14/2026 | Lesson 3: Power Query Fundamentals • Power Query interface and Applied Steps • Data types and headers • Removing rows and columns | Online (Live Session) |
Thursday | 4/16/2026 | Lesson 4: Data Cleaning Techniques Text transformations (trim, split, merge) • Fixing numerical and date formatting • Handling null values and errors | Online (Live Session) |
Lab: Clean a messy sales dataset and produce a standardized table. | |||
Tuesday | 4/21/2026 | Lesson 5: Data Shaping • Conditional columns • Index columns • Grouping and aggregation | Online (Live Session) |
Thursday | 4/23/2026 | Lesson 6: Pivoting & Unpivoting • Wide vs tall data • Restructuring reports for analysis Mini-Project: Convert a manually formatted Excel report into an analysis-ready dataset. | Online (Live Session) |
Tuesday | 4/28/2026 | Lesson 7: Merging & Appending Queries Join types (left, inner, anti) Stacking monthly files | Online (Live Session) |
Thursday | 4/30/2026 | Lesson 8: Data Automation & Quality • Query parameters and reusable functions • Data profiling and validation tools | Online (Live Session) |
Module 3: The Data Model | |||
Tuesday | 5/5/2026 | Lesson 9: Data Modeling • Star Schema: Understanding Fact vs. Dimension tables. • Keys: Primary Keys (Uniqueness) vs. Foreign Keys (Reference). • Normalization: Why we prefer relationships over merged flat tables. | Online (Live Session) |
Thursday | 5/7/2026 | Lesson 10: Creating Relationships • Active vs. Inactive relationships. • Editing relationships and understanding the "Manage Relationships" window. • Handling "Many-to-Many" relationships safely. | Online (Live Session) |
Tuesday | 5/12/2026 | Lesson 11: Advanced Relationship Logic • Cardinality explained (1:*, *:1, 1:1, :) • Cross-Filter Direction: Single vs. Bi directional filtering. • Solving Ambiguity: Managing complex multiple-fact-table models. | Online (Live Session) |
Thursday | 5/14/2026 | Lesson 12: Enhancing the Model • Data Categorization: Geospatial data, image URLs, and barcodes. • Creating Hierarchies: Grouping Year/Quarter/Month or Category/Subcategory. • Hiding utility fields and organizing the Field pane for users. Lab: Build a star schema from normalized tables | Online (Live Session) |
Module 4: DAX (Data Analysis Expressions) | |||
Tuesday | 5/19/2026 | Lesson 13: Introduction to DAX • Calculated Columns vs. Measures: When to use which. • Implicit vs. Explicit Measures: Why you should always write measures. • DAX Syntax basics and commenting code. | Online (Live Session) |
Thursday | 5/21/2026 | Lesson 14: Core Math & Logic • Aggregation Functions: SUM, AVERAGE, COUNT, DISTINCTCOUNT. • Logical Functions: IF, SWITCH, TRUE/FALSE logic. • Basic Math & Stats: DIVIDE (Safe division), MAX, MIN Lab: Build dynamic profit and margin calculations under different filter scenarios. | Online (Live Session) |
Tuesday | 5/23/2026 | Lesson 15: Context & Filtering • Row Context vs. Filter Context: The hardest concept in DAX. • The CALCULATE function: The most powerful function in Power BI. • The ALL family: Removing filters (ALL, ALLEXCEPT, ALLSELECTED). | Online (Live Session) |
Thursday | 5/28/2026 | Lesson 16: Text & Iterators • Text Functions: CONCATENATE, LEFT, RIGHT, SEARCH. • Iterator Functions: SUMX, AVERAGEX (Row-by-row calculations). | Online (Live Session) |
• RELATED & RELATEDTABLE: Fetching data across relationships. | |||
Thursday | 6/4/2026 | Lesson 17: Advanced DAX Scenarios • Rank and Top N analysis. • Variables in DAX (VAR/RETURN): Optimizing performance and readability. • Semi-additive measures (e.g., Inventory counts). Lab: Build dynamic profit and margin calculations under different filter scenarios. | Online (Live Session) |
Module 5: Visualization & AI | |||
Tuesday | 6/9/2026 | Lesson 18: Core Visuals • KPI Visuals: Cards, Multi-row cards, and KPI indicators. • Trending Visuals: Line charts, Area charts, and Ribbons. • Comparison of Visuals: Bar charts, Column charts, and Clustering. | Online (Live Session) |
Thursday | 6/11/2026 | Lesson 19: Interactive Reporting • Filtering: Slicers, Visual-level filters, and Page-level filters. • Navigation: Drill-down, Drill-up, and Drill through functionality. • Bookmarks & Buttons: Creating app-like navigation experiences. | Online (Live Session) |
Module 6: Professional Publishing & Data Storytelling | |||
Tuesday | 6/23/2026 | Lesson 21: Data Storytelling • The principles of effective dashboard design (Color, Layout, White Space). • Reducing Cognitive Load: Removing "Chart Junk" and decluttering. • User Journey: Designing the specific audience (Executive vs. Analyst). Mini-Project: Build a multi-page interactive report with navigation buttons. | Online (Live Session) |
Thursday | 6/25/2026 | Lesson 22: Security & Publishing • Row Level Security (RLS): Managing and viewing roles. • Publishing Power BI Service (Workspaces and Apps). • Dashboards vs. Reports in the Service & Mobile Layout design. Assessment 3: Deploy a secured report to service with role-based access | Online (Live Session) |
Tuesday | 6/30/2026 | Lesson 23: Final Project & Review • Project Presentation: Students present their end-to-end solution. • Peer Review & Instructor Feedback: Optimization tips on their specific models. • Participants build a complete BI solution: raw data → ETL → star schema → DAX → dashboard | Online (Live Session) |
Meet our trainer:
A passionate and results-driven Data Analyst with over four years of hands-on experience, I specialize in transforming raw data into meaningful business insights using tools such as Power BI, Excel, SQL, and Python. With a strong foundation in statistics and real-world industry experience, I bring both technical depth and practical application into every training session.
As a trainer, I am known for my energetic, engaging, and learner-centered approach. I create a positive and supportive environment where complex concepts like data modeling, DAX, and ETL processes become simple, relatable, and enjoyable to learn. My sessions are highly interactive, blending structured guidance with hands-on practice to ensure every participant builds confidence and competence.
I believe learning should be both impactful and enjoyable,so I bring enthusiasm, clarity, and a touch of fun into every class. My goal is not just to teach Power BI, but to empower learners to think analytically, tell compelling data stories, and build solutions that drive real business decisions.
